
Instacart
Analyzing Baskets. Predicting Behavior.

Fast Facts for Busy Reviewers
Goal:
Understand when, what, and how customers shop to improve loyalty, recommendations, and marketing strategies.
Tools Used:
Python (Pandas, Seaborn, Matplotlib) • Jupyter Notebook • Excel
Key Wins:
🕙 Peak shopping hours = 10 AM to 4 PM
🔁 5% of users account for over 50% of all orders
👨👩👧 Families make up the largest shopping group
Strategic Takeaways:
Launch promos before the weekend to catch peak traffic
Create loyalty bundles for frequent shoppers
Push premium items to high-spend, low-frequency users
Explore the Code Behind the Insights

The Challenge
Instacart wanted to better understand its customer base, what people are buying, when they’re shopping, and how the platform could improve recommendations and build loyalty.
So, I dug into real-world order data to explore shopping patterns, segment different types of customers, and uncover what really drives repeat purchases.

Problem
Help Instacart optimize product suggestions and promotions by analyzing user behavior and shopping frequency.

Tools Used
To clean, process, and analyze the data, the following tools were used:
Python (Pandas, Matplotlib, Seaborn)
Jupyter Notebook
Excel

Key Insights
Weekend orders spike especially on Saturdays
A small group of loyal customers (top 5%) drives most of the repeat orders
High spenders don't necessarily order often

Business Suggestions
Create rewards programs for loyal shoppers
Send weekend promos based on peak activity
Offer high-spending users incentives to increase frequency
Data Cleaning Highlights
Before diving into analysis, I made sure the dataset was in good shape. Here’s what I cleaned up:
Fixed column names and standardized formatting
Removed duplicates and checked for missing values
Reclassified variables like spending flags and loyalty segments
Created new flags to help group customers by behavior
🥕 I used .isnull() to check for missing data across orders and product tables, making sure nothing slipped through before moving forward with analysis.
🥕 This before/after table shows how I handled common issues like inconsistent column names, null values, and duplicate rows.
🥕 Visual Tip
I included simple visuals like this to highlight transformations in a clear way no need to guess what changed behind the scenes.


Snapshot of Key Cleaning Improvements
Analytical Build
This analysis went way beyond filtering rows or cleaning columns. I built a streamlined dataset from scratch by merging raw Instacart files and creating new features to actually understand how people shop. Every step I took helped bring more clarity into what customers were buying, when they bought it, and what patterns repeated across time.
🥕 Engineered Features
After building a clean, streamlined dataset, I started engineering new features to actually reflect how people shop. I grouped prices into spending tiers, mapped peak shopping hours, and labeled the busiest days of the week. These added layers turned generic rows into real behavior patterns showing not just what people bought, but when, how often, and how much it mattered.
Created Variables:
price_label– grouped product prices into Low, Mid, and High tiersbusiest_day– labeled each day of the week by how many orders it heldorder_hour_of_day– helped pinpoint when orders peaked during the daybusiest_period_of_day– clustered order hours into Morning, Afternoon, and Evening
Code Pulled From:
4.7 Deriving New Variables.ipynb

🥕 Clustering by Order Type
Not every customer shops the same way. Some stock up weekly like clockwork. Others show up once and vanish. I wanted to dig into those patterns so I grouped users based on how often they reordered, when they shopped, and how many orders they placed overall.

🥕 Order Rhythm Patterns
To understand when customers actually shop, I broke order times into hours, days, and busiest periods. Weekends were big, but it turns out weekday afternoons also saw repeat activity. Orders peaked midday, but there was a clear drop-off after 6 p.m. These timing patterns help identify the most responsive windows for campaigns or feature launches.
Created Timing Insights:
order_hour_of_day– shows when users placed orders throughout the daybusiest_day– ranks days of the week by order volumebusiest_period_of_day– classifies hours into Morning, Afternoon, and Evening blocks
Code Pulled From:
4.7 Deriving New Variables.ipynb
4.9 Data Visualization with Python.ipynb
By clustering order behavior, I could better understand who’s already likely to come back and who might need a little nudge.

These engineered features made it possible to move past surface-level metrics and dig into the real story behind shopping behavior. Without them, the insights wouldn’t have had the same clarity or impact and definitely wouldn’t have translated into anything actionable.
Want to see the full build in action? Explore the full Jupyter Notebooks here:
➔ Instacart Analysis: Notebooks on GitHub
Key Visuals & What They Show
🥕 Orders by Day of the Week
Most orders were placed on weekends, especially Sundays (~85,000 orders) and Mondays (~78,000 orders). This tells us promotions and ads should go live by Friday night to catch peak weekend traffic.

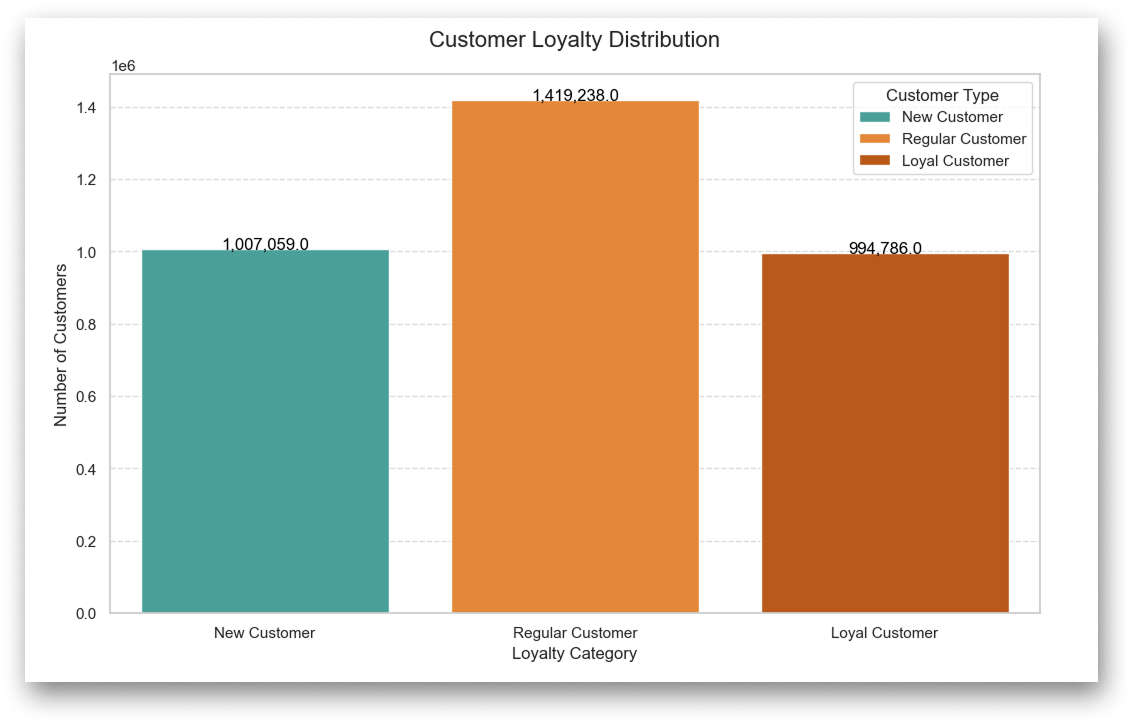
🥕 Customer Loyalty:
After filtering out inactive users (those with fewer than 5 orders), I found that 62.5% of returning customers placed more than 10 orders. That’s over 1.4 million regular shoppers, making this group ideal for investing in when it comes to loyalty programs and personalized offers.
🥕 Regional Shopping Patterns:
Shoppers in the Midwest ($12.72) and South ($12.25) regions spend the most on average, while "Other" regions and the West lag behind with lower spending (around $11.30). These insights can help Instacart prioritize premium promotions in high-spending areas and offer discount-based incentives where needed.

🥕 Family-Oriented Shoppers :
Couples with 1–2 dependents made up the largest household group at 1.3 million users, while both Singles (650K) and Families with 3+ dependents (657K) also represented sizable segments. Household size clearly shapes product needs—larger families may be looking for bulk or family-friendly deals, while smaller households might prioritize convenience and flexibility.

Main Insights (Recap)

💰 Big Spenders = Frequent Shoppers
Around 30% of high-spending users placed fewer than 5 orders, highlighting a major opportunity for Instacart to re-engage these customers through incentives or premium loyalty perks. These shoppers spend more per order but shop less frequently and that’s a gap worth closing.
🛒 Weekends = Peak Order Days
Sunday and Monday had the highest order volumes, with over 84,000 and 78,000 orders respectively. In contrast, Friday and Saturday saw fewer than 60,000 orders. This confirms that the weekend rush starts early, and promotions should go live by Friday night to capture peak traffic.

🔁 Repeat Shoppers = Loyalty Potential
40.9% of orders came from repeat users, and among returning customers, 62.5% placed more than 10 orders. That’s a loyal audience worth prioritizing in retention strategies like rewards programs and personalized deals.
🧀 Staples = Stickiness
Produce (Dept 4) led with 7.5 million products ordered, followed by Dairy & Eggs (Dept 16) at 4 million making them the two most-purchased departments. These fresh essentials play a key role in driving return visits and reinforcing loyalty. Their consistent demand makes them ideal targets for retention promos and personalized product recommendations.

🧭 Regional Spending Varies
Customers in the Midwest ($12.72) and South ($12.25) spend the most per order, indicating strong potential for premium product promotions in these regions. In contrast, the West ($11.32) and Other regions ($11.38) show lower average spending, suggesting they might respond better to discount-based strategies. These insights support a localized marketing approach, tailored to regional spending behaviors.
From Data to Decisions

This project taught me how to apply Python-based analytics to uncover real customer behaviors and shopping patterns at scale. By working with a large, complex dataset, I gained hands-on experience with:
Data cleaning and merging using pandas
Creating flags for segmentation (e.g., loyalty, spending, frequency)
Visualizing trends using Matplotlib and Seaborn
Writing actionable insights that connect data to real-world strategies
Business Recommendations:
01: Target Peak Days with Timely Promotions
Launch ads or discounts by Friday evening to maximize visibility over the weekend, when order volume surges.
02: Prioritize Frequent Shoppers
With over 1 million customers placing 20+ orders, loyalty programs and personalized discounts could strengthen retention and long-term engagement.
03: Engage High-Spend, Low-Frequency Users
Roughly 30% of high spenders placed fewer than 5 orders that’s a solid opportunity to re-engage them with exclusive perks, tailored bundles, or subscription incentives that make it easier (and more rewarding) to come back.
04: Promote Staple Categories
Departments like Produce and Dairy & Eggs dominate purchases. Featuring these in promotions can drive retention.
05: Localize Offers by Region
Shoppers in the Midwest and South spend more per order. Consider regional-specific incentives or premium item promotions in those areas.
Explore the Code Behind the Insights
Want to dive into the full analysis, see how data was cleaned in Excel, or explore the Python code used for clustering and visualizations? The entire project from preprocessing in Excel to modeling in Jupyter Notebook is available on GitHub.