



TIMELINE
2024
ROLE
Data Analyst
TYPE
Market Analysis
TOOLS
Python • Tableau • Excel • Jupyter Notebook
OVERVIEW
Snapshot
An analysis of global video game sales focused on regional preferences, publisher performance, and market trends.
GOAL
Help GameCo understand global sales patterns by region, genre, and publisher to support smarter marketing, partnerships, and platform investments.
TOOLS USED
Excel
Tableau
Jupyter Notebook
Pandas
Seaborn
Scikit-learn
KEY FINDINGS
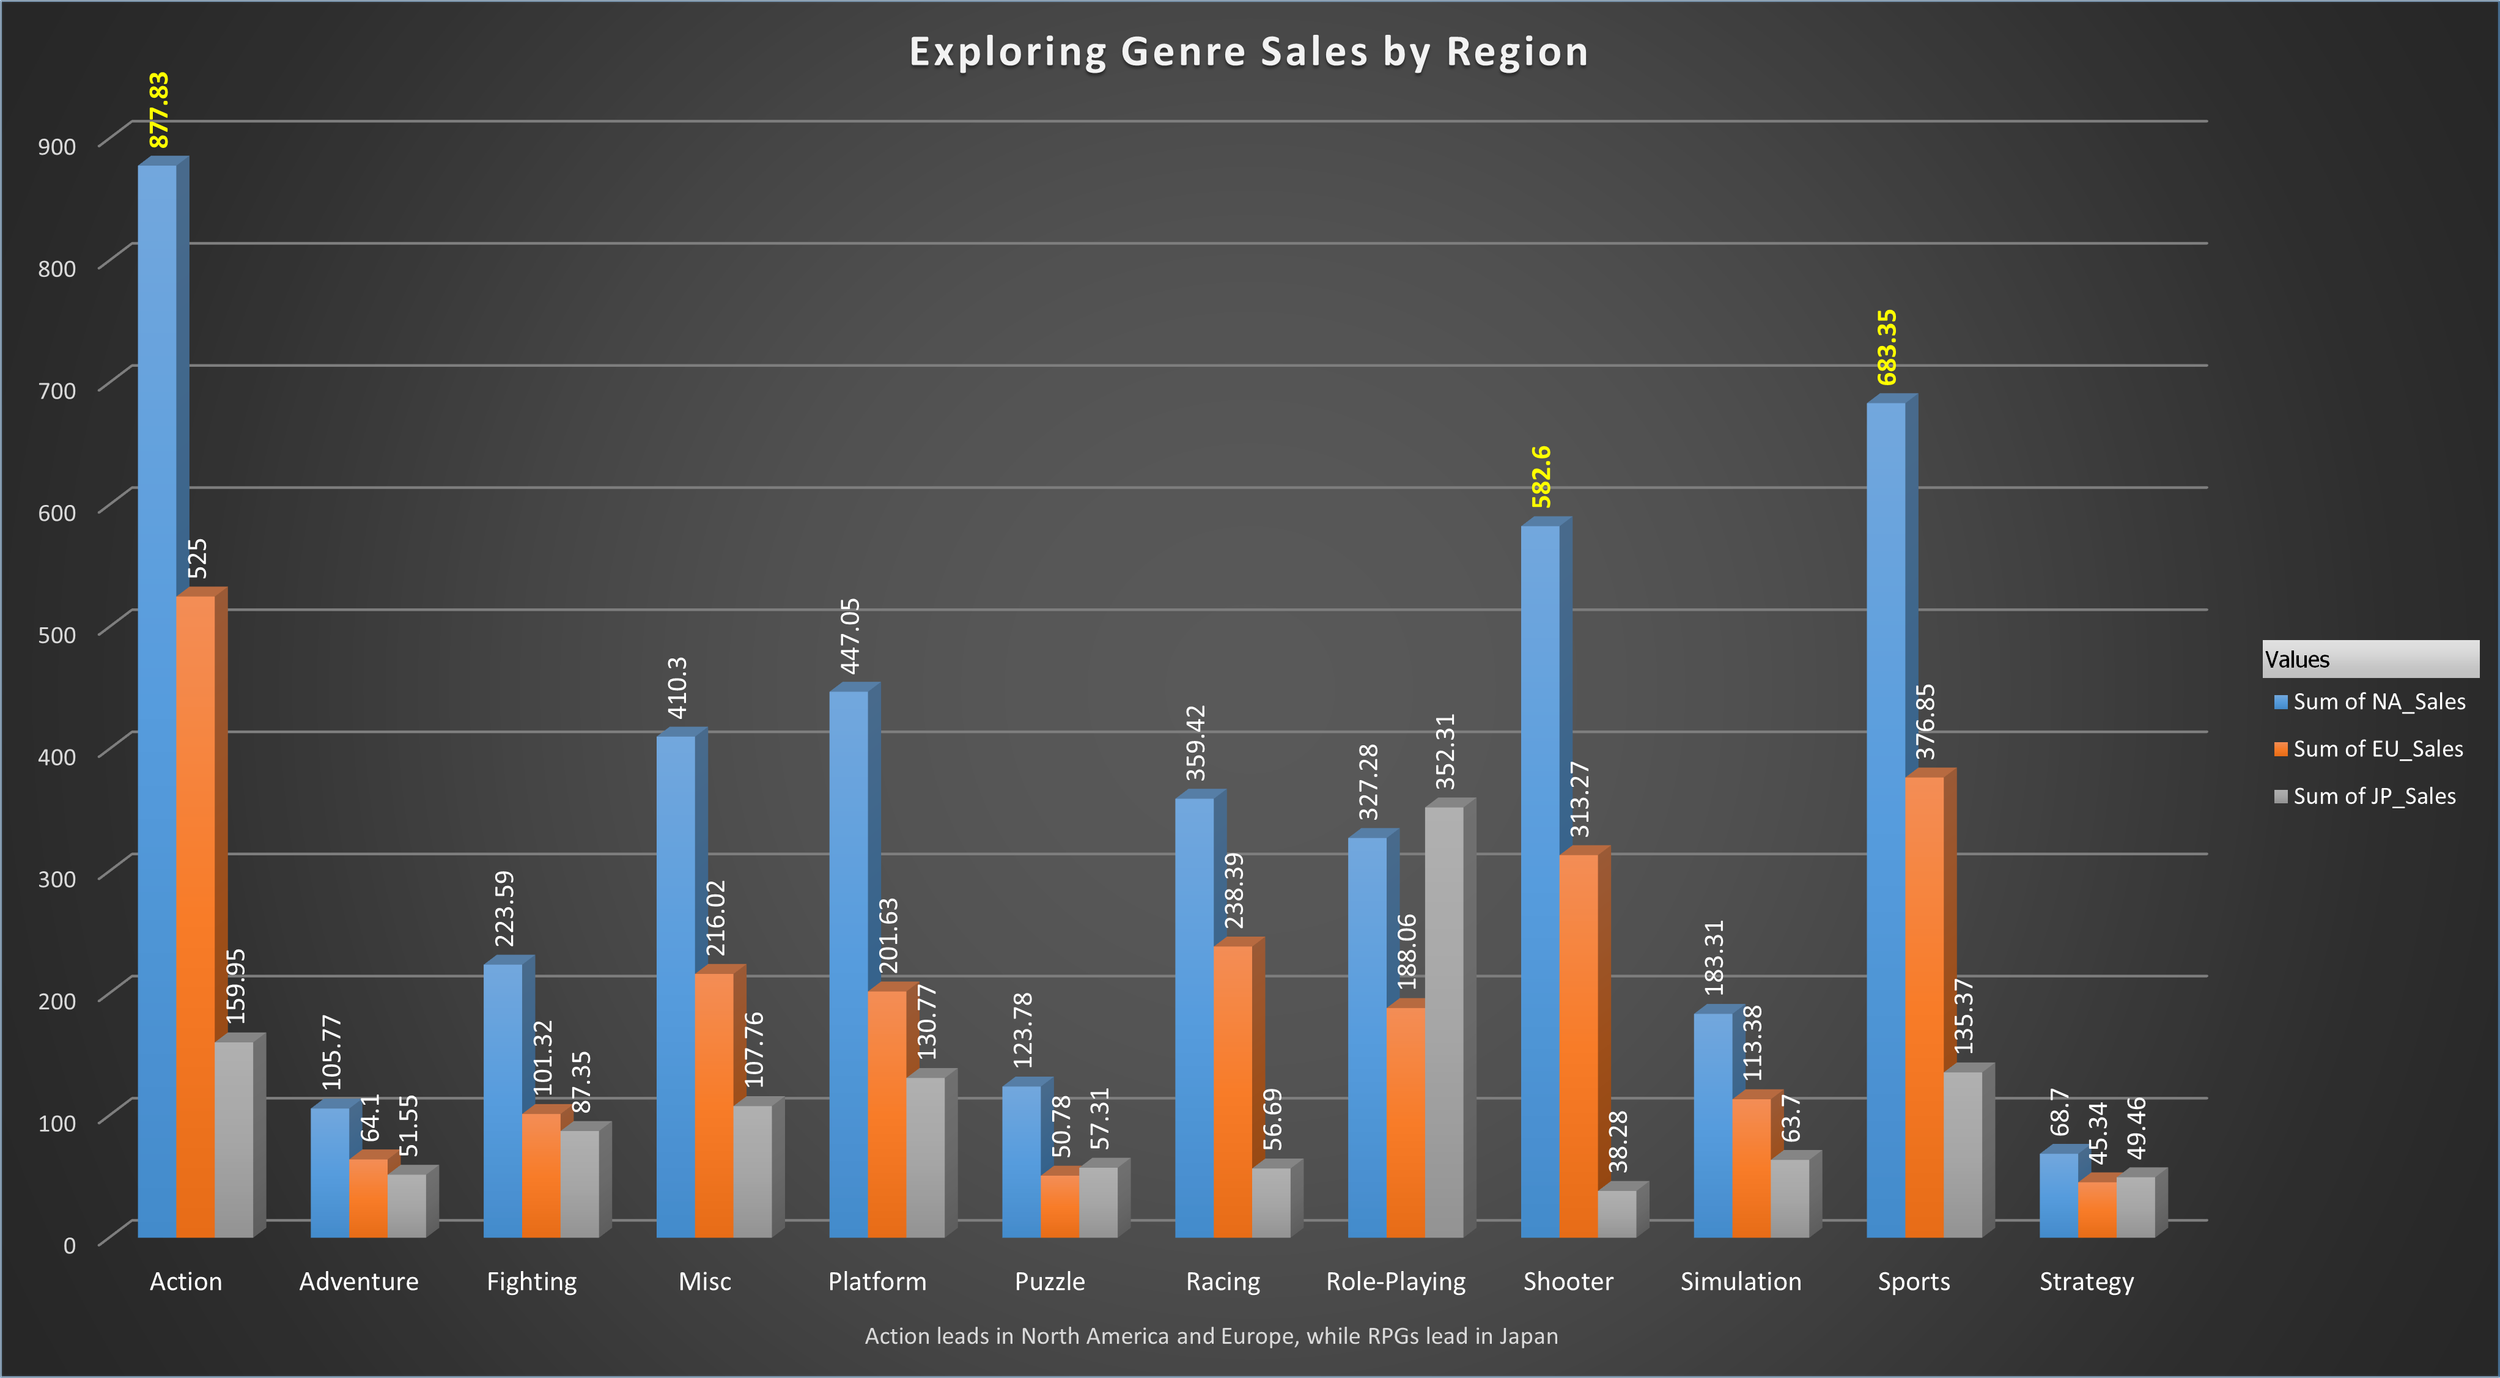
• Action games lead in both North America and Europe, while RPGs stand out in Japan.
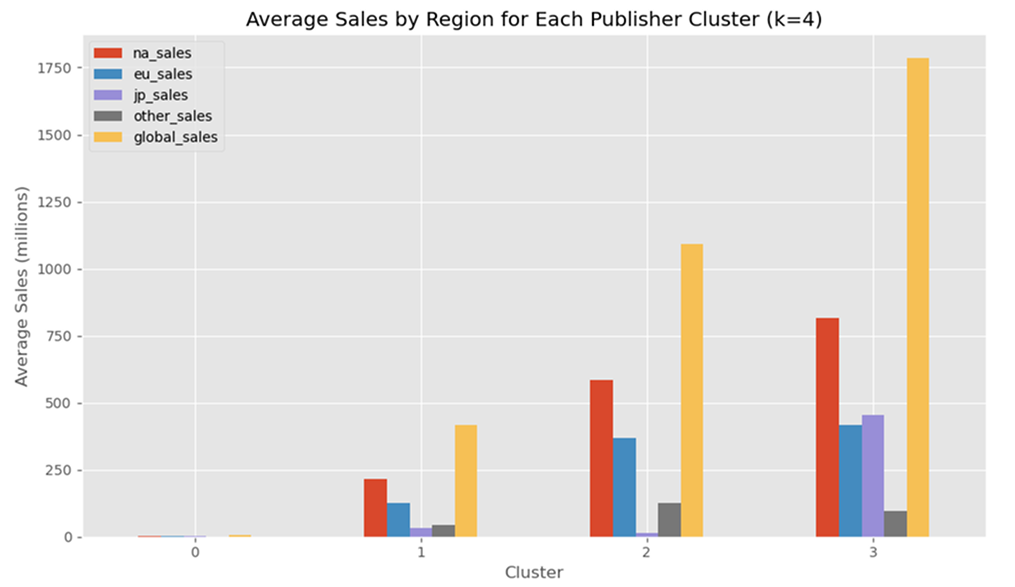
• Publisher performance varied across regions, showing that strong global sales did not always mean balanced market reach.
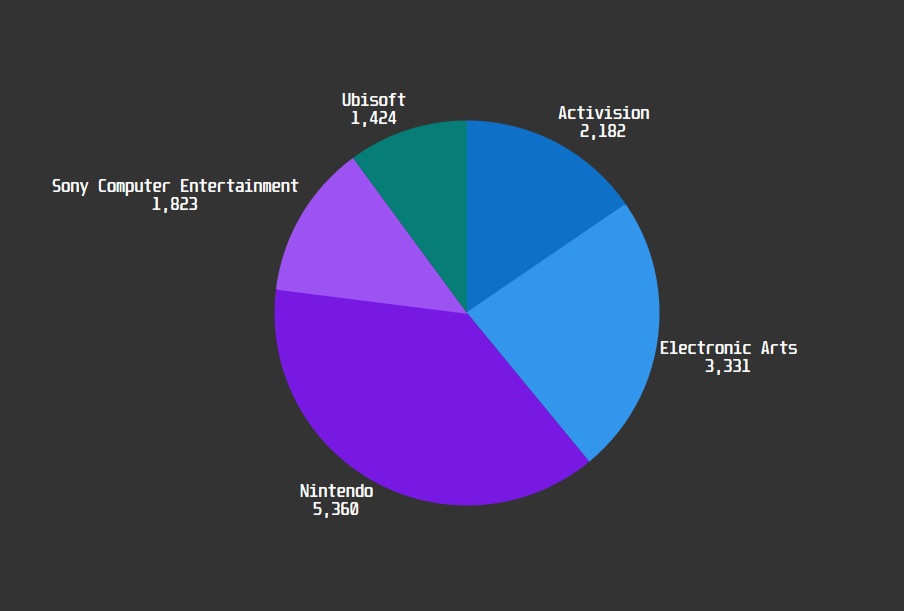
• Nintendo leads global publisher sales, followed by Electronic Arts and Activision.
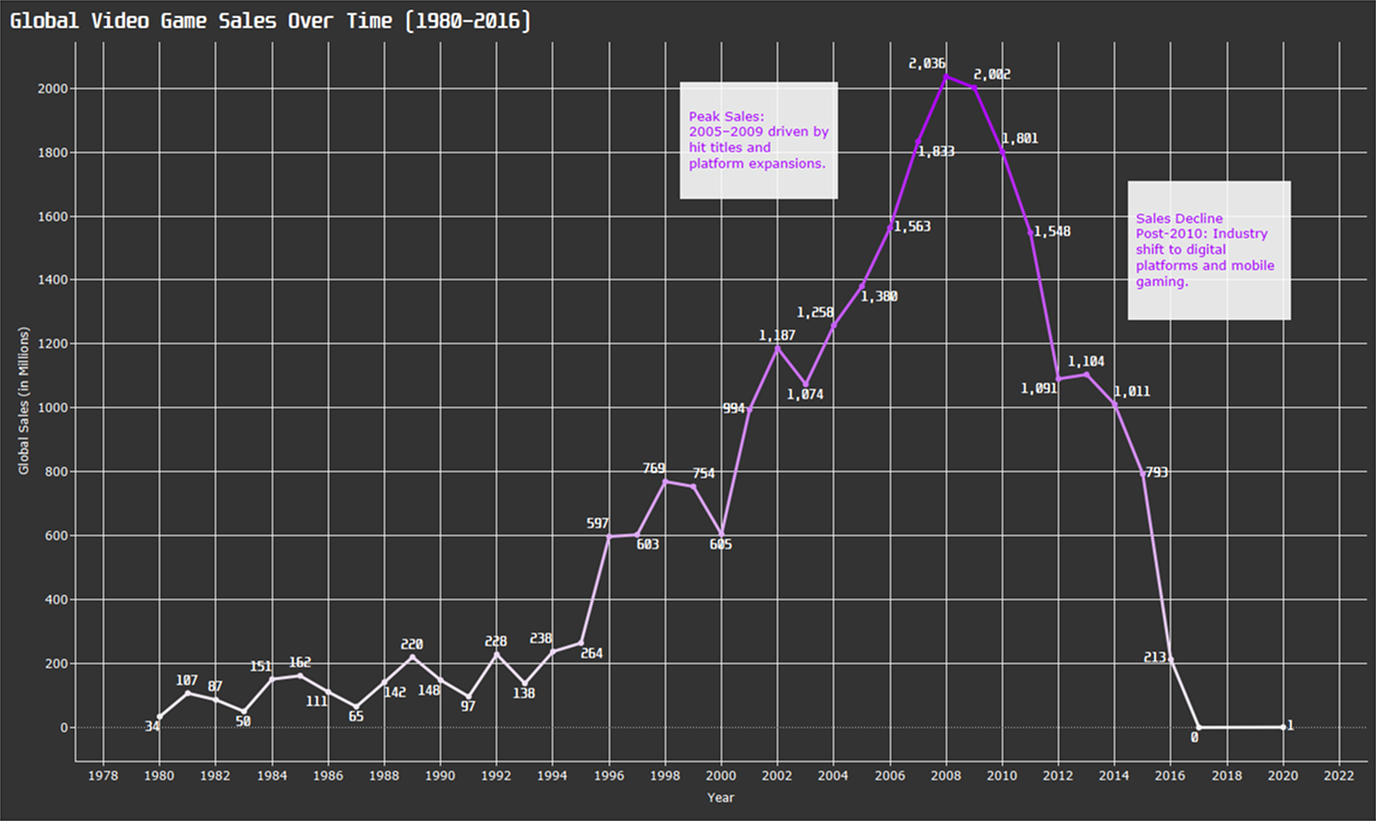
• Global sales peaked between 2005 and 2009 before dropping sharply after 2010 as the market began to change.
OUTPUT & RECOMMENDATIONS
• Tailor regional campaigns around the genre patterns identified in each market, including Action in North America and Europe and RPGs in Japan.
• Explore publisher partnerships based on regional and genre opportunities.
• Adjust inventory and promotions based on platform trends and lifecycle stage.
• Use Tableau and presentation slides to make the findings easier to understand and act on.
16K+
GAME RECORDS ANALYZED
Cleaned and analyzed across platforms, regions, publishers, and release years
4
GLOBAL REGIONS
NA, EU, Japan, and Rest of World compared across all metrics
4
MARKET LENSES ANALYZED
Genre, region, publisher, and platform
THE PROBLEM
The Challenge
GameCo had decades of global sales data, but the bigger problem was understanding what those numbers actually meant across different markets. Genre preferences, publisher performance, and platform trends did not follow the same pattern everywhere.
The challenge was to identify which differences mattered most, then turn those patterns into recommendations GameCo could use for marketing, partnerships, and platform planning.
The core question: How do sales patterns differ across regions, genres, publishers, and platforms, and what do those differences suggest for GameCo’s strategy?
-
More than three decades of records included inconsistent names, missing values, and repeated titles across different platforms.
-
Genre preferences varied across North America, Europe, Japan, and other markets.
-
Genre, region, publisher, platform, and year needed to be compared without losing the bigger picture.
-
The analysis needed to support clear recommendations, not just describe what happened.
“Global sales data tells you what sold. Regional breakdowns tell you where it sold. The gap between those two things is where the strategy lives.”
— THE FRAMING THAT SHAPED THE ANALYSIS
INPUT PREPARATION
Cleaning decades of gaming data
The dataset contained 16,000+ game records spanning several decades, with inconsistent genre, platform, and publisher names, missing values, and records with little or no usable sales data.
I standardized names and column labels, removed rows with missing publisher, platform, or global sales information, and checked that regional sales totals matched the global sales figures.
I then created clean versions of the dataset for Tableau, Excel, and Python so I could compare regions, genres, publishers, and platforms without messy records getting in the way.
Key decision: I removed records missing essential sales, publisher, or platform information and standardized inconsistent labels before moving into the analysis.
HOW I WORKED
Analytical Approach
I started with the larger sales trends, then looked closer at how genre, region, publisher, and platform changed the story.
01
Genre by region
Compared genre sales across North America, Europe, Japan, and other markets to identify regional preferences.
02
Sales trend timeline
Tracked global sales by year to identify industry peaks, declines, and broader market shifts.
03
Publisher clustering
Grouped publishers by regional sales patterns to uncover differences in market reach and regional strength.
04
Strategic recommendations
Turned the findings into recommendations for regional marketing, partnership opportunities, and platform planning.
See the full project on GitHub
Explore the cleaned datasets, Jupyter notebooks, clustering analysis, Tableau
workbook, slides, and project documentation.
PROJECT REPOSITORY
WHAT THE DATA REVEALED
Four patterns that reframed the strategy
The strongest findings came from comparing regional demand, sales shifts, and publisher performance instead of relying on global totals alone.
Click for a closer look
KEY FINDING 01
The same genres did not lead in every region
Action games performed strongest in both North America and Europe, while RPGs stood out in Japan. The regional breakdown showed that the same genre pattern did not hold across every market.
Click for a closer look
KEY FINDING 02
Game sales peaked between 2005 and 2009
Global sales reached their highest point between 2005 and 2009 before dropping sharply after 2010, marking a clear change in the long-term sales pattern.
Click for a closer look
KEY FINDING 03
Regional Publisher Strengths
The bar chart compared average sales across the publisher groups created through clustering. Some groups performed strongly across several regions, while others were stronger in only one or two.
Click for a closer look
KEY FINDING 04
Nintendo led global publisher sales
Nintendo recorded the highest global sales among the leading publishers, followed by Electronic Arts, Activision, Sony Computer Entertainment, and Ubisoft.
The finding that reframed the brief: GameCo could not treat every market the same. Regional genre preferences and differences in publisher strength showed where a more focused strategy could make a real difference.
WHAT I LEARNED
Main Insights
01
Global totals hide regional differences
Looking only at global totals would have flattened the regional differences that mattered most. The analysis showed why market-level context needs to come before a one-size-fits-all strategy.
02
The market shifted after its peak
The sharp change after the peak reinforced that historical performance is context, not a blueprint. Strategy needs to adjust when the market pattern changes.
03
Publisher sales were concentrated among major players
Publisher sales were not evenly distributed. A small group of major publishers accounted for much of the strongest performance, which made competitive position important to the analysis.
04
Clustering revealed patterns that totals missed
Clustering made differences in publisher behavior easier to see than totals alone. It gave me another way to compare how publisher strength changed across markets.
DECISION LOGIC
From Insight to Decision
The value of the analysis was not just identifying patterns. It was connecting those patterns to decisions GameCo could make across regional marketing, partnerships, and platform planning.
01
Finding
Regional genre preferences were different
Recommendation
Tailor campaigns by market instead of using the same message everywhere, with regional genre patterns guiding where each campaign should focus.
02
Finding
Sales peaked between 2005 and 2009
Recommendation
Adjust inventory, promotions, and platform plans as sales patterns change instead of relying on what worked during the industry’s peak years.
03
Finding
Publisher strength varied by region and platform
Recommendation
Look for partnership opportunities where publisher strength is lower in specific regions or market segments.
04
Finding
Publisher clusters revealed different sales profiles
Recommendation
Use regional sales behavior to compare publisher profiles and identify where GameCo may have room to position itself more clearly.
The bigger takeaway: Working across decades of sales data taught me that the hardest part was not finding patterns. It was deciding which differences mattered enough to shape a recommendation.
EXPLORE THE WORK
See the Full Analysis
View in Tableau
Explore the sales trends by region, genre, publisher, platform, and year.

View the code on GitHub
Explore the cleaned data, Jupyter notebooks, clustering work, Tableau files, reports, and project documentation.

View the slides
Review the main findings, charts, and recommendations prepared for a stakeholder audience.
