


TIMELINE
2025
ROLE
Data Analyst
TYPE
Consumer Behavior Analysis
TOOLS
Python • Pandas • Excel
OVERVIEW
Snapshot
A behavioral analysis of over 3 million Instacart grocery orders, uncovering shopping patterns, customer loyalty, peak ordering times, and opportunities for stronger marketing and product decisions.
GOAL
Analyze customer purchasing behavior across a large dataset to identify patterns in shopping frequency, loyalty, timing, spending, and product preferences.
TOOLS USED
Python
Pandas
Matplotlib
Seaborn
Jupyter Notebook
Excel
KEY FINDINGS
• Peak ordering activity concentrated around midday, with Sunday and Monday showing the highest order volumes.
• 62.5% of returning customers placed more than 10 orders.
• Around 30% of high spending users placed fewer than 5 orders.
• Produce and Dairy & Eggs were the most frequently purchased departments.
OUTPUT & RECOMMENDATIONS
• Behavioral segmentation across shopping frequency, loyalty, spending, and household patterns
• Targeting recommendations based on peak shopping times
• Product and department insights to support more relevant promotions
• Recommendations focused on retention and re-engaging lower-frequency shoppers
3M+
ORDERS ANALYZED
Cleaned, merged, and processed using Python and Pandas
62.5%
RETURNERS WITH 10+ ORDERS
Returning customers who placed more than 10 orders
10 AM to 4 PM
PEAK ORDER WINDOW
Highest concentration of shopping activity during the day
THE PROBLEM
The Challenge
Instacart had millions of order records, but the raw data did not show the larger patterns behind how customers shop. The analysis needed to connect what people bought, when they ordered, how often they returned, and how those behaviors differed across customer groups.
The harder part was deciding which patterns mattered and how to turn them into findings a business stakeholder could use.
The core question: What does large-scale grocery ordering behavior reveal about customer habits, loyalty, timing, and product preferences, and how can those patterns support smarter business decisions?
-
3M+ orders across multiple datasets required careful cleaning, merging, and processing.
-
Not every pattern in the data leads to a meaningful business insight.
-
Customer groups needed clear criteria based on frequency, loyalty, spending, and household patterns.
-
Findings had to connect to decisions, not just describe what happened.
“3 million orders don't tell you why people buy. But the patterns in when, what, and how often they buy reveal how shopping behavior takes shape.”
— THE FRAMING THAT GUIDED THE ANALYSIS
INPUT PREPARATION
Preparing more than 3 million orders for analysis
The Instacart dataset included multiple CSV files covering orders, products, departments, aisles, and order product relationships. These needed to be merged, cleaned, and validated before the analysis could begin.
I identified and removed duplicate entries, checked for missing values, standardized column naming across files, and created derived variables for spending tiers, busiest days, and shopping periods throughout the day. These features helped support the segmentation and behavioral analysis that followed.
The key insight from cleaning: Structuring the data around timing, frequency, spending, and reorder behavior made the larger shopping patterns easier to see.
HOW I WORKED
Analytical Approach
The analysis moved from broad shopping patterns to more specific customer behavior, using timing, frequency, spending, and product data to understand how people shop.
01
Time pattern analysis
Mapped order volume by hour and day to identify peak shopping times and quieter periods.
02
Loyalty classification
Grouped customers by total order count to identify different levels of customer loyalty.
03
Spend segmentation
Created Low, Mid, and High product price tiers to support spending analysis.
04
Department mapping
Compared purchasing patterns across departments to identify the categories customers bought most often.
See the full project on GitHub
Explore the Jupyter notebooks, Python code, cleaning steps, feature engineering,
and visualizations behind the analysis.
PROJECT REPOSITORY
WHAT THE DATA REVEALED
Four patterns that shaped the recommendations
The strongest findings came from looking at shopping behavior from four angles: timing, product demand, repeat ordering, and regional spending. Together, they showed where customer behavior differed and where more targeted recommendations made sense.
Click for a closer look
KEY FINDING 01
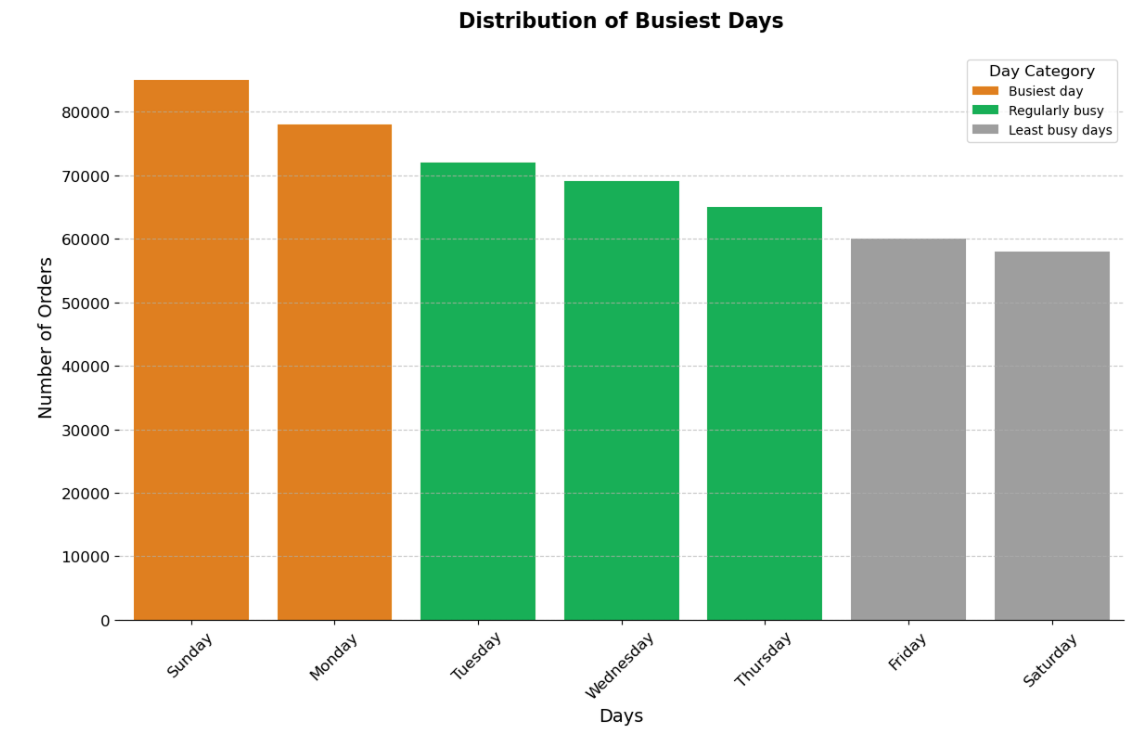
Sunday and Monday lead order volume
Sunday had the highest order volume at about 85,000 orders, followed by Monday at about 78,000. Friday and Saturday were the quietest days, suggesting promotions could be timed ahead of the Sunday and Monday peaks.

Click for a closer look
KEY FINDING 02
Produce and Dairy & Eggs lead product demand
Produce was the most-purchased department at about 7.5 million products ordered, followed by Dairy & Eggs at about 4 million. Their consistently high order volume made these staple categories useful areas to consider for product recommendations and promotions.
Click for a closer look
KEY FINDING 03
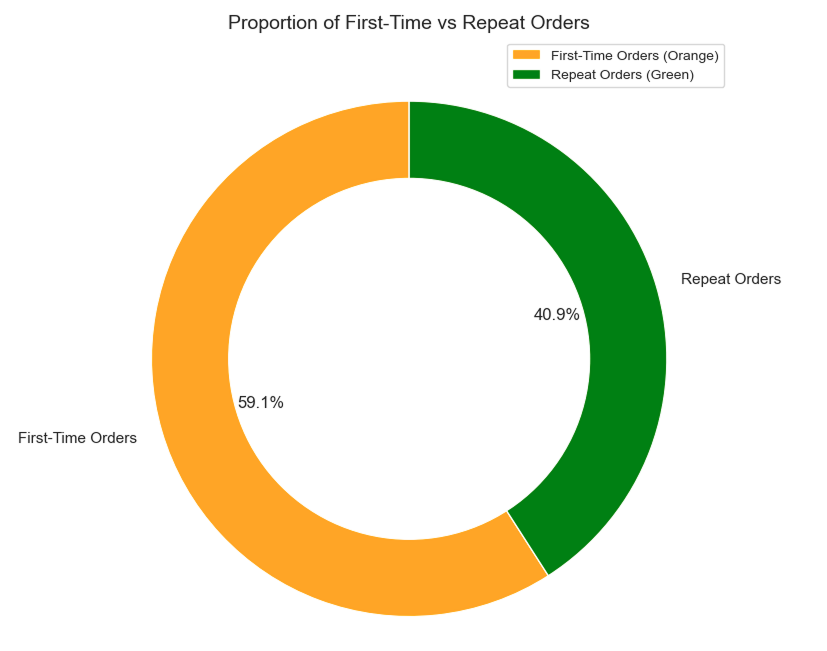
Repeat orders show strong loyalty potential
Repeat orders accounted for 40.9% of all orders, showing that repeat purchasing represented a substantial share of order activity and making retention worth exploring further.
Click for a closer look
KEY FINDING 04
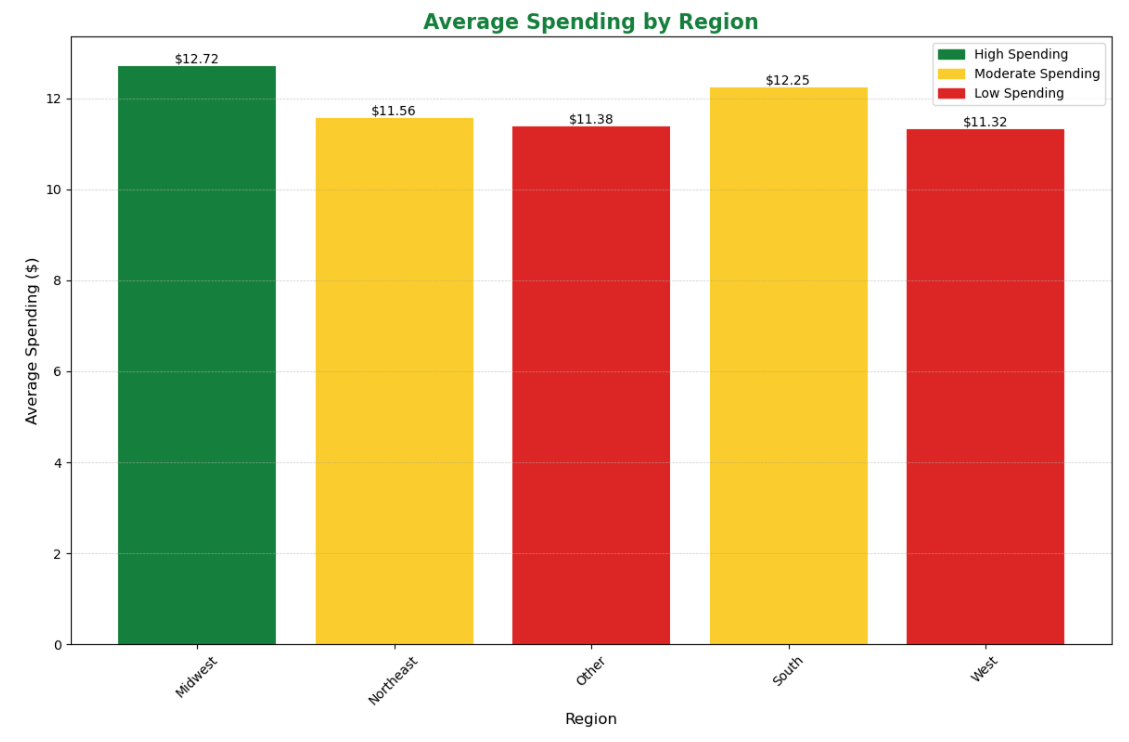
Regional spending patterns are not the same
The Midwest had the highest average spending at $12.72, followed by the South at $12.25. The West and Other regions were lower at $11.32 and $11.38, showing regional differences that could help inform where premium or discount-based promotions might be tested.
The pattern that surprised me most: High spending customers were not always frequent shoppers. Around 30% placed fewer than five orders, which showed that strong spending did not automatically lead to loyalty. This revealed another opportunity: giving high-spending, low-frequency customers a stronger reason to return.
WHAT I LEARNED
Main Insights
01
Timing shapes the opportunity
Orders were highest on Sunday and Monday, while shopping activity peaked between 10 AM and 4 PM. Promotions should reach customers before these busy periods, not after shopping activity has already started.
02
Repeat shoppers show strong retention potential
Repeat purchasing showed strong retention potential, making returning customers a useful group to consider for rewards, personalized offers, and loyalty programs.
03
High spend shoppers are a re-engagement opportunity
This gap between spending and frequency created a clear re-engagement opportunity worth testing.
04
One strategy will not fit every shopper
Spending differed by region, and household groups varied in size. These differences suggest that regional and household based offers could be tested rather than using the same promotion strategy for everyone.
DECISION LOGIC
From Insight to Decision
The strongest patterns in the analysis translated into practical recommendations around timing, retention, and customer targeting.
01
Finding
Sunday and Monday lead order volume
Recommendation
Launch promotions by Friday evening so they are already visible when shopping activity starts to build. Time campaigns around real customer behavior instead of sending them at random.
02
Finding
Returning customers show strong loyalty potential
Recommendation
Consider rewards, personalized offers, and loyalty programs for returning customers. With 62.5% placing more than 10 orders, this group showed strong retention potential.
03
Finding
High spending customers do not always shop often
Recommendation
Test targeted perks, bundles, or subscription style incentives with high spending customers who place fewer orders to see whether those offers encourage more frequent purchasing.
04
Finding
Spending and household patterns vary across customer groups
Recommendation
Use more targeted offers instead of one campaign for everyone. Regional spending and household differences could be used to test which promotions work best for different customer groups.
What I learned: Working with more than 3 million orders taught me that writing the Python was only part of the work. The real value came from knowing which findings were worth carrying forward and how to make them useful.
EXPLORE THE WORK
See the Full Analysis
View the code on GitHub
See how I built new features, segmented customer behavior, and created the Python visualizations behind the analysis.
